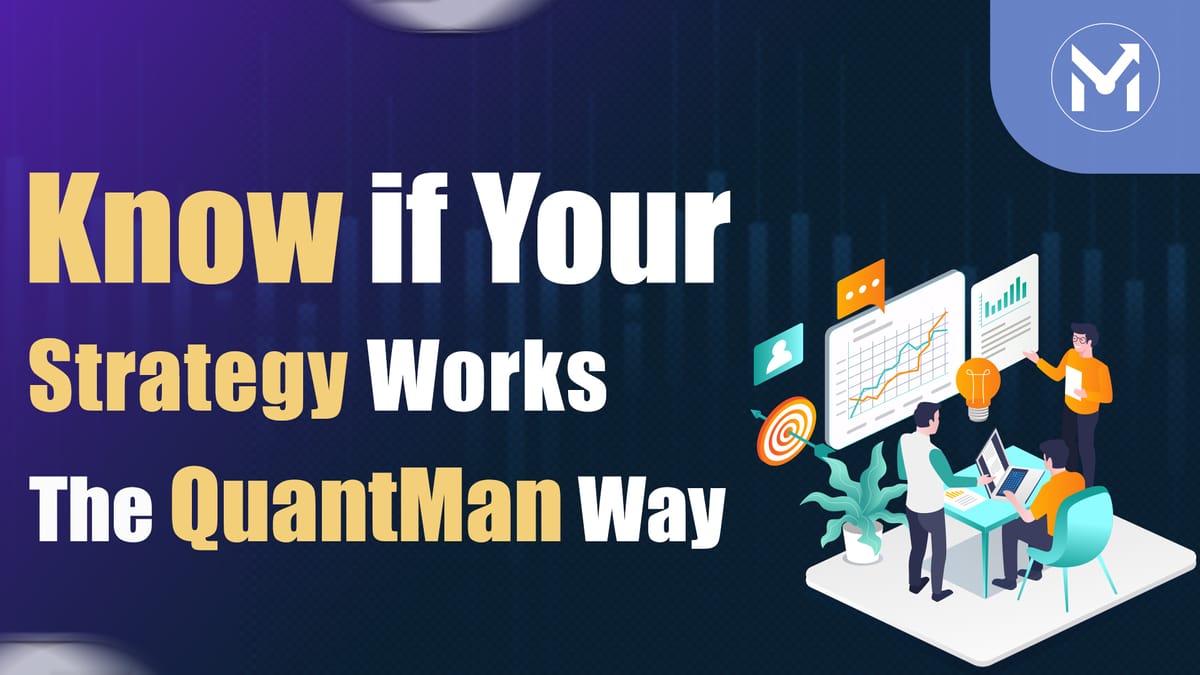
How to Know if Your Strategy Works—The QuantMan Way
Wondering if your trading strategy really works? This blog explains how QuantMan’s Strategy Builder and Backtest Page let you compare multiple strategies, analyze win probability, average P&L, drawdown, and risk per trade, and confidently choose the most profitable setup
Every trader asks the same question: “Does my strategy really work?” The answer often feels hidden behind complex data, expert opinions, or endless trial and error. But what if you could judge a trading strategy’s potential all by yourself—in just five steps? With QuantMan Strategy Builder and Backtest Page, you can compare multiple strategies side by side, uncover their strengths and weaknesses, and confidently pick the winner. No guesswork, no dependence on specialists—just clear insights. Let's look at the procedures to know the potential of a strategy step-by-step.
Step 1: Build Your Strategy
Everything begins with the QuantMan Strategy Builder. Here, you define your conditions—for example, a simple Long CE Buy trade. That’s your foundation. But the real power lies in copy‑and‑edit.
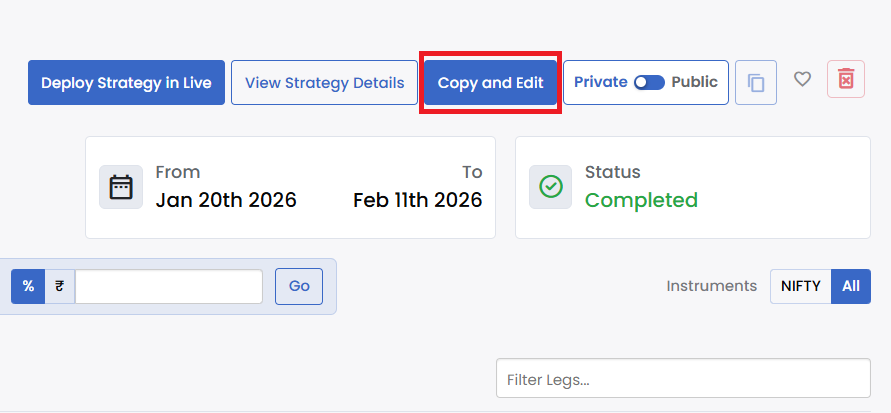
You can duplicate your base idea and tweak it into multiple variations. Imagine creating two strategies, both centered around a Long CE buy, but with slightly different conditions. Now comes the big question: Which one is better?
Step 2: Backtest Your Strategies
Head over to the QuantMan Backtest Page. Run the backtest for each strategy, then open them side by side under My Strategies. This is where the detective work begins. The backtest page offers a wealth of data, but don’t feel overwhelmed. You only need to focus on four key metrics—the ones that truly reveal whether your strategy is efficient.
Step 3: The Four Key Metrics
1. Winning Probability
This tells you how often your strategy wins compared to total attempts. A higher winning probability sounds exciting, but frequent small wins can be wiped out by one big loss. Treat this as your first clue, not the final verdict.
2. Average Profit & Loss (P&L)
This metric shows the quality of each trade. In our case study, Strategy 2 wins less often but delivers bigger wins. Its average profit is 2.25 times its average loss—meaning stronger outcomes per successful trade. Think of it like cricket batting styles: one player scores small runs consistently, while another hits fewer but massive sixes. Both can work, but you need to know which fits your risk appetite.
3. Drawdown
Drawdown measures how much your account dips during losing streaks. Lower drawdown means smoother recovery and less stress. Strategy 1 looks safer here, with lower drawdown, offering stability for traders who value predictability.
4. Risk Per Trade (RPT)
This is the ultimate decision-maker. RPT consolidates all other parameters. Strategy 2, despite slightly higher drawdown, shows stronger RPT thanks to higher average profit and minimal average loss. Its max profit is three times greater than Strategy.
Step 4: Putting It All Together
- Strategy 1: Higher win probability, lower drawdown, safer feel.
- Strategy 2: Better average P&L, stronger RPT, higher max profit.
At first glance, Strategy 1 looks appealing. But when strategies clash, RPT decides the winner. That’s why Strategy 2, despite fewer wins and slightly higher drawdown, comes out on top. Final reveal: Strategy 1 earned ₹1,97,000, while Strategy 2 delivered ₹2,95,000.
Step 5: Pro Tips for Smarter Evaluation
- If average P&L is similar, choose the one with higher win probability.
- Aim for a risk‑reward ratio of 1:2 or higher when the win probability is lower.
- Prefer strategies with fewer trades if profits are equal—less brokerage and charges.
- A slightly higher drawdown is acceptable if profitability is significantly better and aligns with your risk tolerance.
Conclusion
Evaluating a strategy doesn’t need expert intervention. With QuantMan, you can:
- Build multiple variations with ease.
- Backtest and compare side by side.
- Focus on the four key metrics.
- Use RPT as the ultimate tie‑breaker.
Bottom line: Strategy 2 proved superior, showing that profitability and risk balance matter more than just win probability. So next time you wonder if your strategy works, remember: QuantMan makes testing, learning, trading smarter and simple.